Reports on Dell/EMC Symmetrix array performance by executing RESTAPI calls to a Unisphere server.
By default, only the last hour of metric data points are displayed for any performance category.
The following Symmetrix performance reports are available for one or more storage arrays.
| Report | Description |
|---|---|
| ArrayMetrics | General storage array performance metrics |
| FrontEnd | Front End director performance metrics |
| QDC-FrontEnd | Queue Depth Count for Front End directors |
| SysCall | Array SysCall performance metrics |
| StorageGroup | Table of Storage Groups for a symmetrix array |
| Summary | IO Performance Summary metrics for all storage arrays. Updates every 6 seconds. |
| SGPerformance | Storage Group performance for named SG or all SGs on a FA port (CLI only). |
To get detailed help information and/or examples of executing Get-VeSymmMetrics can be displayed by entering, the following command.
PS> get-help .\Get-VeMetrics -full
Get-VeSymmMetrics supports CLI based method of execution by specifying specific parameters or a GUI based method where parameter values are selected from dialog boxes.
Executing this cmdlet without parameters will result a dialog being displayed for selection of a RestAPI/Unisphere server and the associated storage arrays. Select one or more storage arrays from a specific RestAPI server.
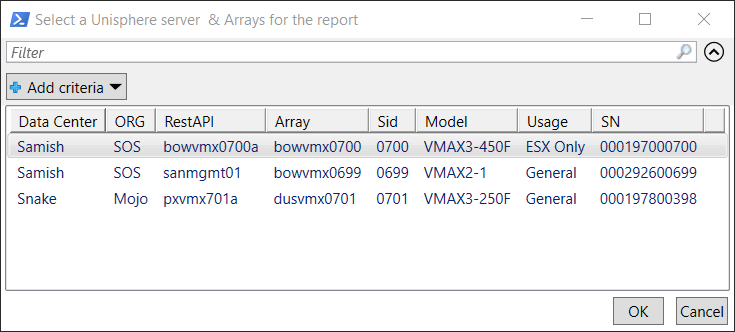
Select the desired RestAPI server and one or more associated arrays and click on the 'OK' or the 'CANCEL' button. If 'OK' was selected, a dialog will be presented showing the available performance reports for selection.
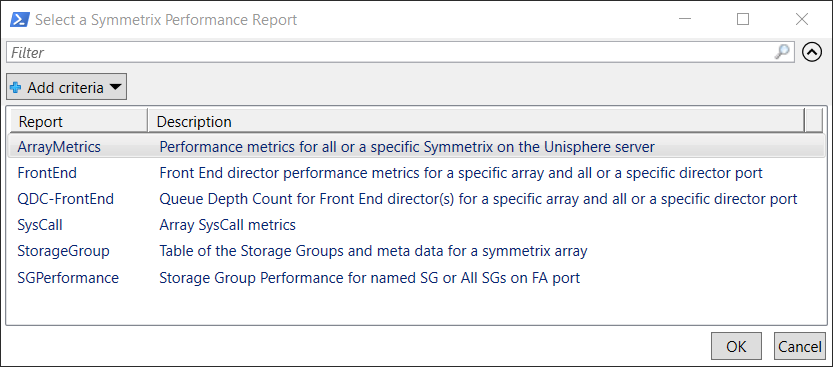
Select the desired report and click on the 'OK' or the 'CANCEL' button.
Depending on the report selected other dialogs may be presented for selection of required parameter values otherwise the report will be displayed.
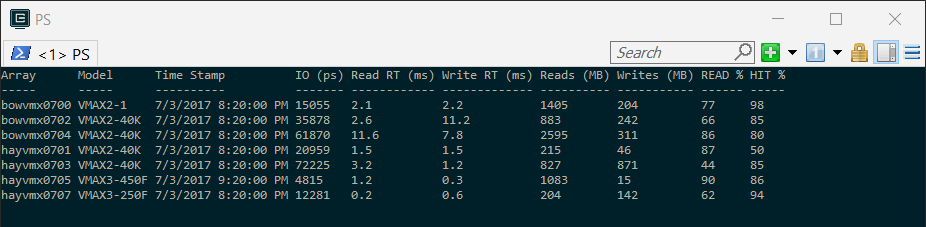
Other useful performance data can be displayed directly on the the PowerShell console such as the Performance summary report for whole storage infrastructure.
PS> Get-VeSymmMetrics -report summary
This will display IO metrics for all storage arrays within is a specific organization category. By default the first Org value found in the XMLDB will be displayed when the parameter is not specified. To display IO metrics for a specific Org value include the 'org' parameter in the command.
PS> Get-VeSymmMetrics -report summary -org Mojo
Using the CLI based method of executing, Get-VeSymmMetrics can be very useful when a large volume of data points are processed. The following CLI method collects 24 hours of storage group performance metrics and summarizes the metrics in a CSV output file.
PS> Get-VeSymmMetrics boxvmx0700 0700 -report SGPerformance -sg bowesx271-278_sg -csv -secs 86400
PS> Get-VeSymmMetric sanmgmt01 0699 -report SGPerformance -sg boxesx681-688_sg -csv -secs 86400
PS> Get-VeSymmMetric hayvmx0701 0701 -report SGPerformance -sg bowesx771-778_sg -csv -secs 86400
The output from each of the above executions is summarized in a CSV file named, SG-Performance-Summary.csv located in the SGInfo folder.
Use the command line help to see other options for displaying performance data.